Epidemiologic concepts: incidence and prevalence
Epidemiology is the underlying and basic science of public health. It could be defined as any research of health events in populations, including:
- How many are affected by such events?
- Is the risk increasing or decreasing?
- What is the relevance of the problem?
- How could it be prevented?
Two of the key concepts of epidemiology are incidence and prevalence.
Prevalence:
Prevalence looks at existing cases, while incidence looks at new cases.
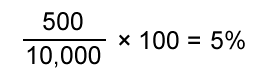
In a population of 10,000 people, 500 persons are reported to be affected by a certain disease. So what is the prevalence of this disease in this population?
The mathematical way to calculate this would be:
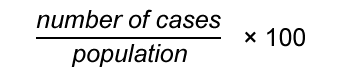
This formula will provide us with the information as a percentage. By dividing 500 by 10,000 and multiplying the result by 100 (to make it a percentage), we find out that 5% of the population is affected. So the prevalence of the disease in our population is 5%.
Rather than expressing prevalence as a percentage, we can also describe it as the number of people affected in a standard sized population, for example 1,000 people. So instead we would calculate:
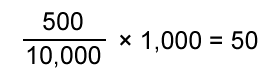
This means that for every 1,000 patients, 50 of them have the disease.
Prevalence is like describing a group photo:
- How many people can you see there? That number is your population.
- How many people share a certain feature (e.g. same hair colour)? This number is used to calculate prevalence.
In epidemiology, we actually have three different ways to calculate the prevalence:
- Point prevalence: The number of cases of a health event at a certain time. For example, in a survey you would be asked if you are currently smoking.
- Period prevalence: The number of cases of a health event in reference to a time period, often 12 months. For example, in a survey you would be asked if you have smoked during the past 12 months.
- Lifetime prevalence: The number of cases of the health event in reference to the total lifetime. For example, in a survey, you would be asked if you have ever smoked.
Incidence:
HIV is nowadays a treatable infection with a normal life expectancy. This means that with stable numbers of new cases, prevalence numbers will increase. Looking at the new cases (incidence) provides a deeper understanding of what is going on.

In a population of 1,000 non-diseased persons, 28 were infected with HIV over two years of observation. The incidence proportion is 28 cases per 1,000 persons, i.e. 2.8% over a two year period or 14 cases per 1,000 person-years (incidence rate), because the incidence proportion (28 per 1,000) is divided by the number of years (2).
Factsheets
- Fact Sheet: Incidence
Size: 102,625 bytes, Format: .docx
A factsheet giving detailed examples of how to calculate the incidence of a health event as a function of total new cases over a specific period of time divided by the total population.
- Fact Sheet: Prevalence
Size: 103,393 bytes, Format: .docx
A factsheet giving detailed examples of how to calculate the prevalence of a health event as a function of the number of individuals affected by a health event divided by the total population.
A2-1.03-V1.2